Instagram Analytics Reports to Boost Engagement
Last Updated on February 20, 2026 by Ethan
To boost Instagram engagement, you need analytics reports that tell you what content gets saved, shared, replied to, and clicked, not just what got “liked.” The fastest wins usually come from tracking a few repeatable engagement reports weekly, then making small changes based on what the data is actually doing.
I’ve run these reports on everything from tiny creator accounts to chunky brand profiles where posts get a few thousand likes but somehow still don’t move the needle. Same story every time: when you build analytics reports for engagement around saves, shares, comments, and Story interactions, the content plan gets way easier (and less emotional).
Here’s the stuff I actually pull up in Instagram analytics in 2026, what’s really going on behind the scenes, the benchmarks I usually look at, the spots where the reports tend to mislead you, and a simple way to turn those numbers into more replies, more comments, and people who keep coming back.
TL;DR: To enhance Instagram engagement, focus on analytics reports that highlight saves, shares, comments, and Story interactions, rather than just likes. Honestly, these are the numbers that usually tell you what people actually cared about, and they make planning your next posts a lot less guessy. By understanding these signals, you can boost interaction and reach more effectively.
What “analytics reports for engagement” actually are (and what they aren’t)
An engagement analytics report is just a structured snapshot of how people interacted with your content over a period of time, plus enough context to answer “what should I do next?” It’s not a pretty dashboard you screenshot once and forget.
Here’s the key shift a lot of people still haven’t made: engagement isn’t one metric anymore. Likes are the laziest interaction on the app, and Instagram basically treats them like background noise compared to saves and shares.
The engagement signals that matter most right now
- Saves: “I want this later.” In practice, this is the strongest “value” vote you can get on a post.
- Shares: “Someone else should see this.” This is the growth lever.
- Comments (and comment quality): Not just “nice,” but actual sentences, questions, back-and-forth threads.
- Story interactions: Poll votes, quiz taps, emoji sliders, question replies. These are sneaky powerful because they’re effortless for viewers.
- DMs and link clicks: For creators selling anything, this is where the money and the real intent lives.
One lived-detail thing I’ve noticed: on accounts under 5k followers, a single “save-heavy” post can spike your weekly reach in a way that feels random until you look at the saves. On larger accounts (50k+), that same effect still happens, but it usually shows up as a longer tail: the post keeps getting pushed for days instead of hours.
How Instagram engagement analytics works (the mechanism, not the myth)
Instagram doesn’t “reward” you for posting. It rewards you for holding attention and triggering meaningful interactions, because that keeps people in the app.
Here’s the simplified mechanism I explain to clients: Instagram tests your post on a small portion of your audience, watches early signals (especially saves, shares, and comments), then decides whether to keep distributing it. That’s why two posts with similar like counts can perform wildly differently in total reach.
Why “views” are showing up everywhere in Insights
In 2026, Insights leans hard into views across formats. That’s not Instagram being cute, it’s Instagram trying to normalize metrics across Reels, Stories, carousels, and photo posts so they can compare content types more directly.
And yes, it can be confusing. I still catch myself double-checking whether I’m looking at “accounts reached” vs “views” when I’m moving fast.
Counterintuitive insight: 100 likes + 20 saves can beat 500 likes + 2 saves
You’d think a post with 500 likes is “better.” But I’ve tested this enough times to be annoying at parties: if one post triggers real “keep” behavior (saves) and “spread” behavior (shares), it often gets more distribution than a post that people double-tap and instantly forget. Likes don’t mean loyalty. Saves do.
If you want a solid overview of what metrics are emphasized right now, I like skimming guides like InfluenceFlow’s Instagram analytics breakdown for 2026 and then validating it against what my own accounts are doing.
The core Instagram analytics reports I use to boost engagement
You don’t need 40 reports. You need a handful you’ll actually check consistently.
1) Engagement rate report (but calculated the right way)
Engagement rate is still the headline metric because it normalizes performance. Look, 300 interactions on a 3k account is a big deal, but 300 on a 300k account is, in most cases, kind of a shrug.
I track engagement rate in two different ways because they answer different questions. And one of them is the simple follower version: (total engagements ÷ followers) × 100. Good for internal consistency over time.
- By reach: (total engagements ÷ reach) × 100. Better for judging content quality independent of account size.
Benchmarks I use in 2026: 1-3% is average, 3-5% is excellent for many niches. Micro-influencers (10k-100k) can hit 4-8% when they’re dialed in. B2B is the humbling one: I’ve seen solid B2B accounts sit at 0.8-1.5% and still generate real leads.
If you want a step-by-step formula walkthrough (and a few gotchas), this cluster piece is handy: how to track Instagram engagement rate.
2) “Saves and shares” content report (your real engagement leaderboard)
This is the report most people skip, and it’s the one I’d keep if I had to delete everything else.
Create a simple table (or export) with your last 30 posts and sort by:
- Saves per reach
- Shares per reach
- Comments per reach
Then tag each post with what it was: checklist, hot take, tutorial, before/after, storytime, meme, behind-the-scenes, etc. Patterns show up fast. Like, weirdly fast.
One more lived detail: carousel “how-to” posts often win on saves, while Reels with a sharp hook win on shares. When you lump them together without labeling format, you’ll think your content is inconsistent. It’s not. Your formats just behave differently.
3) Story interaction report (the “quiet engagement” most dashboards miss)
Stories are where your warm audience hangs out. And the engagement is often “silent” if you only look at likes and comments.
What I track weekly:
- Poll votes and quiz taps (volume and percentage)
- Replies (especially if you asked a real question)
- Link clicks (if you’re driving traffic)
- Forward taps vs exits (a rough “boring vs interesting” signal)
Interactive Story metrics are also more “honest” than people think, because tapping a poll is low effort. If your polls are getting ignored, your topic or framing is off. Simple.
4) Reels engagement report (watch time proxies + comments)
Instagram doesn’t give you a perfect “watch time” report the way YouTube does, so you have to use proxies: views, replays, shares, saves, and comment rate.
And yes, Lives matter too. When I run Lives with creators, comments can jump massively compared to normal posts. The “10x more comments” claim checks out in my experience, but only when the Live has a reason to exist (Q&A, teardown, guest, challenge). Random “hanging out” Lives tend to flop unless you’re already famous. Brutal, but true.
5) Audience activity curve report (post timing that’s not guesswork)
This is the easiest engagement win to explain and the hardest one to get people to stick with.
Your audience has activity windows. When you consistently post slightly before that peak, you give your content a better shot at getting early engagement. And early engagement is what triggers wider distribution.
Third-party tools can map this more clearly, but even native Insights is enough if you actually check it weekly.
Benchmarks that won’t make you spiral
People love benchmarks until benchmarks make them feel bad.

Here are the ones I use so clients don’t chase the wrong goal:
- Overall engagement averages: Instagram tends to sit roughly around 0.48-0.6% overall, depending on the dataset. Social benchmarks change, but they’re a useful reality check. (Social Insider keeps a running set of benchmark data, which I reference when a niche feels “off”: social media benchmarks.)
- Niche reality: Fashion often beats B2B. Local service businesses can be weirdly strong on comments. Meme pages distort everything.
- Micro-influencer advantage: 10k-100k accounts often have the best engagement when the creator replies to comments quickly and uses Stories daily.
One mistake I made early on (and I’m not proud of it): I chased a 3% target on a B2B account because I saw some creator bragging about it. I basically forced the content into clickbait to “hit the number,” and leads got worse. The account looked better. The business didn’t. Lesson learned.
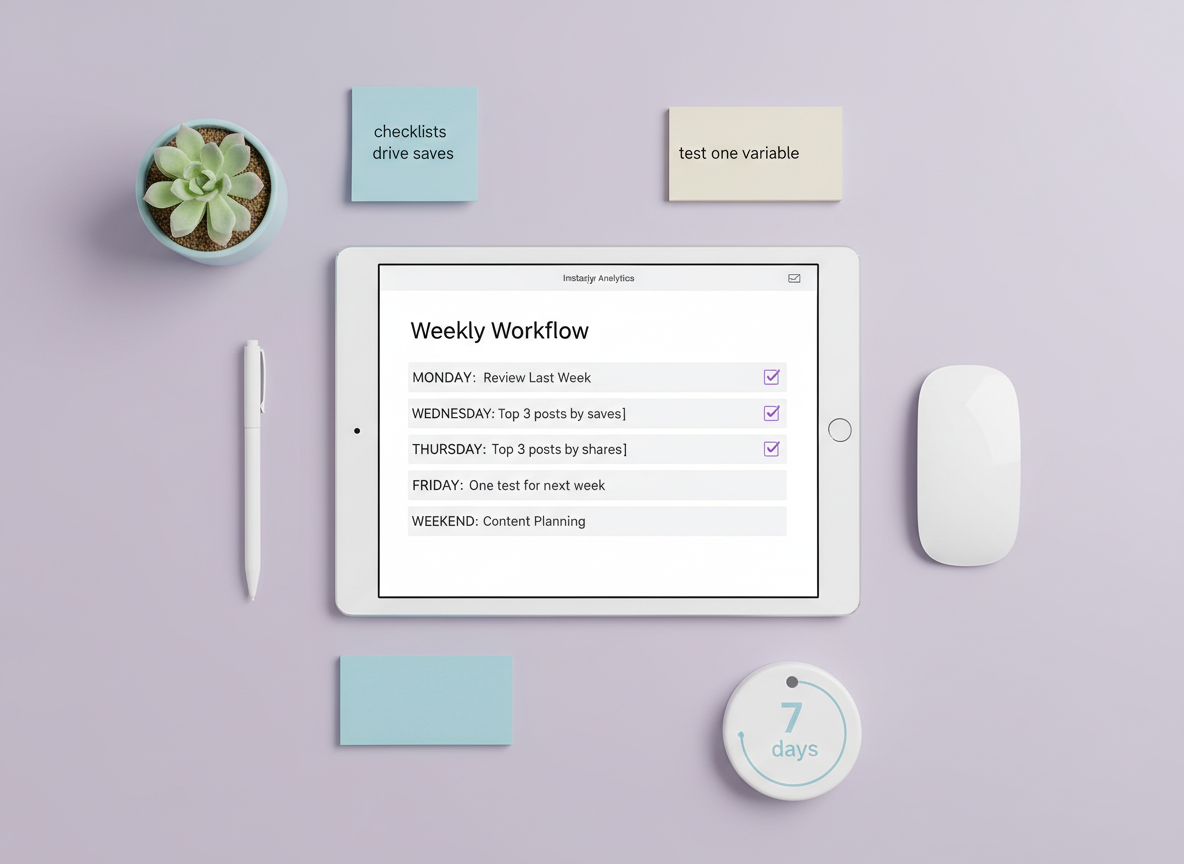
How to build an engagement report you’ll actually use (simple weekly workflow)
If your report takes 2 hours, you won’t do it. That’s the whole game.
- Pick your time window (7 days for fast feedback, 28-30 days for trend spotting). Don’t mix windows week to week or you’ll confuse yourself.
- Pull a post list (last 10-20 pieces of content) and capture: reach/views, likes, comments, saves, shares.
- Calculate engagement rate by reach for each post, then sort best to worst. If you only have time for one calculation, do this.
- Tag each post with format and intent: Reel, carousel, photo; educational, entertaining, personal, promotional.
- Write three takeaways in plain English. Not “improve hooks.” More like: “Checklists drive saves” or “Behind-the-scenes drives replies.”
- Pick one test for next week. One. Otherwise, you’ll change five things and won’t know what worked.
I usually keep a tiny “test log” note on my phone. Nothing fancy. If I don’t write it down, I forget what I changed, and then I’m back to vibes-based marketing. Nope.
Instagram Insights vs third-party tools (what I’ve seen in the real world)
Native Instagram Insights is fine for most creators. The problem is consistency and depth, especially with Stories, and when you want longer history or cleaner exports.
I’ve used a bunch of third-party platforms over the years. Some are great. Some are essentially reskinned spreadsheets with a monthly fee. The good ones help with automated calculations, hashtag tracking, and pattern detection over time without manual work.
If you’re deciding what to trust, this explainer helps frame the tradeoffs: Instagram Insights vs third-party analytics tools.
And if you want to nerd out on what a proper dashboard setup looks like for teams, this Instagram analytics dashboard overview gives a solid feel for how pros structure reporting across channels.
Failure mode: when reports “break” or mislead you
- Format shifts: Reels and carousels don’t behave the same. Comparing them directly without context gets weird fast.
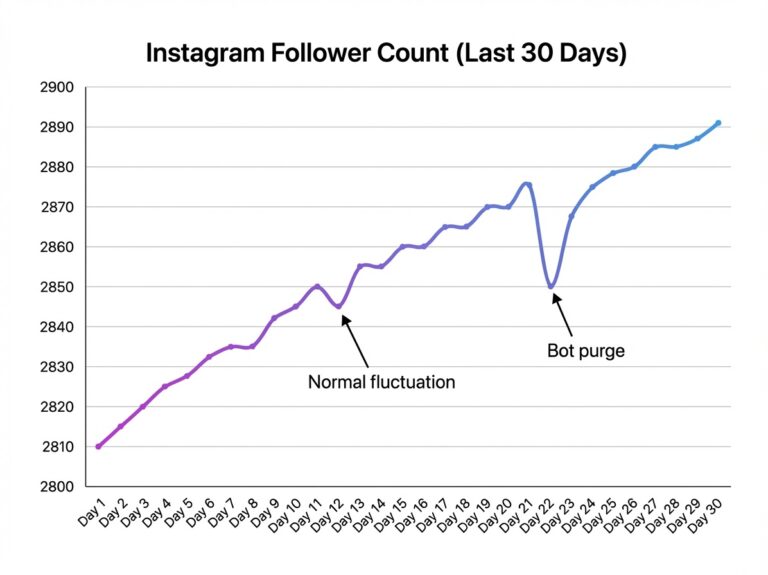
- Viral outliers: One spike can mess up your averages and make your “normal” posts look terrible. I often use medians for internal reporting when an account has frequent spikes.
- Short windows: A 24-hour report can lie. Some posts bloom late, especially save-heavy educational content.
Common mistakes I see people make with engagement reports
These show up constantly, even with smart creators.
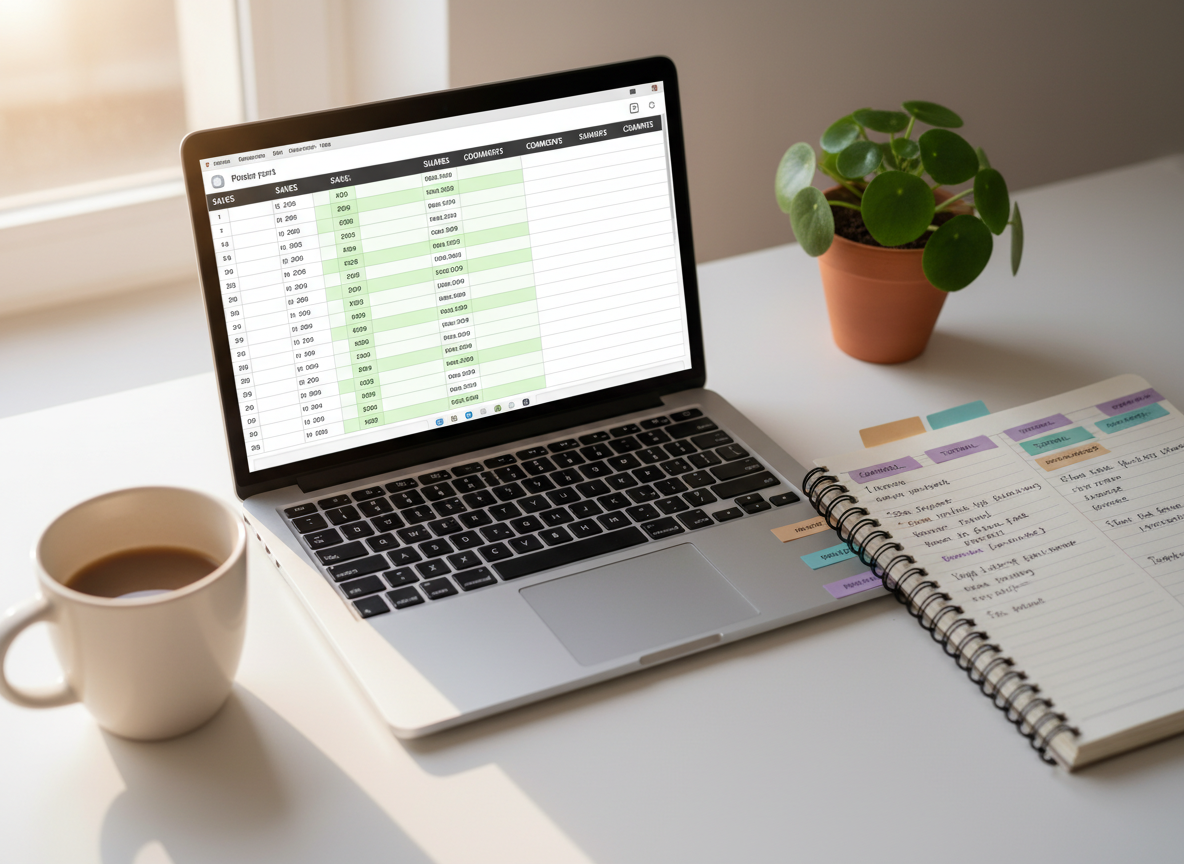
Illustration for analytics reports for engagement article. Overhead view of a content creator’s work
- Chasing the wrong benchmark: If your niche averages 1%, aiming for 5% can push you into gimmicks that hurt long-term trust.
- Over-weighting likes: I get it, likes feel good. But they’re not the metric that usually triggers meaningful distribution anymore.
- Ignoring early engagement: If you can reply to comments in the first hour, do it. I’ve watched posts “wake up” just because the creator stayed active and the thread kept going.
- Not tracking private intent: DMs, profile visits, website taps. If you sell anything, this is your engagement reality, not the public metrics.
- Changing too many variables at once: New hook, new topic, new posting time, new format… then wondering what worked. Been there. It’s a mess.
Reporting templates I recommend (pick one and stick to it)
You’ve basically got three report styles that cover 95% of needs:
A) Weekly “content performance” engagement report (fast feedback)
- Top 3 posts by saves per reach
- Top 3 posts by shares per reach
- Bottom 3 posts (so you stop repeating them)
- One hypothesis for why the winners won
- One test for next week
B) Monthly “audience and format” engagement report (strategy)
- Engagement rate trend (4-week rolling)
- Reels vs carousels vs photos: which drives saves, shares, comments
- Story interaction trend: replies, poll votes, link clicks
- Best posting windows based on audience activity
C) Campaign engagement report (launches, collabs, promos)
- Baseline vs campaign period engagement
- Content sequence performance (teaser, announcement, proof, CTA)
- Traffic and conversion proxies (link clicks, DMs, coupon usage)
If you’re also trying to connect engagement with follower movement, this broader resource gives useful context: Instagram follower analytics guide.
Limitations (what engagement analytics reports won’t tell you)
Engagement reports are powerful, but they’re not mind-reading.
- They won’t tell you “why” someone saved. A save could mean “useful,” or it could mean “I hate this but want to show my friend.” Rare, but it happens.
- They don’t fully capture brand lift. Some content makes people trust you more without triggering an obvious metric spike.
- Private accounts and privacy settings can limit tracking. Depending on the tool and the data source, you may not get the same depth you’re used to.
Also, your mileage varies with niche and audience maturity. A brand-new account often has noisy data for the first few months. It’s not failing. It’s just still “settling.”
How UnfollowGram Follower Tracker helps with engagement reporting
Most people think of engagement as “likes and comments,” then they get confused when their follower count dips after a post that supposedly “did well.” That’s one reason we built tools like UnfollowGram: to connect the dots between content performance and follower movement without asking for your Instagram password.
When I’m auditing accounts, I’ll often pair engagement reports with a lightweight follower change check using UnfollowGram’s no-login follower tracking for spotting unfollow patterns after content drops. It’s not about obsessing over who left. It’s about noticing repeatable patterns, like “salesy posts cause a small unfollow wave” or “controversial Reels bring in new followers but also trigger some churn.” That context makes your engagement analytics feel way less abstract.
Honest caveat: UnfollowGram isn’t trying to be a full suite analytics dashboard with every metric under the sun. What it does well is daily tracking for public accounts, fast, and with zero password sharing, which matters a lot because I’ve seen people get burned by sketchy apps that ask for credentials. If you want to go deeper on monitoring engagement and growth together, this is a useful companion read: Instagram activity tracker for monitoring followers, engagement, and growth. And for brands running from Meta Business Suite, business account follower analytics covers the specifics.
FAQ
What is an example of an analytical report?
An example is a weekly Instagram engagement report that lists your top posts by saves and shares per reach, plus a short summary of what content themes drove the best interactions.
How to create an engagement report?
Pick a time window (7 or 28 days), export or record post metrics (reach/views, likes, comments, saves, shares), calculate engagement rate by reach, then sort winners and write one test for next week.
What are the three main types of analytical reports?
The three common types are descriptive reports (what happened), diagnostic reports (why it happened), and predictive reports (what’s likely to happen next).
What is engagement analytics?
Engagement analytics is the measurement and analysis of how people interact with your content, such as saves, shares, comments, Story taps, replies, and link clicks.
What’s a “good” engagement rate on Instagram in 2026?
For many niches, 1-3% is average and 3-5% is excellent, but micro-influencers can reach 4-8% and B2B often sits lower while still performing commercially.
Should I report engagement by followers or by reach?
Use followers for consistency over time and reach for judging content quality; if you only choose one, engagement rate by reach is usually more informative.
Conclusion
The Instagram accounts that grow engagement aren’t guessing, they’re running a few simple analytics reports for engagement every week: engagement rate by reach, saves and shares leaderboards, Story interaction trends, and format-based comparisons. The big unlock in 2026 is treating saves, shares, replies, and clicks as your primary signals, then using small weekly tests to compound results.
If you want to connect engagement performance with follower movement (without handing over your password), UnfollowGram can be a practical add-on to your reporting stack. Keep it simple, track consistently, and let the data tell you what your audience actually wants.

Ethan is the founder of UnfollowGram with more than 12 years of experience in social media marketing. He focuses on understanding how Instagram really works, from follower behavior to engagement patterns, and shares those insights through UnfollowGram’s tools and articles.