How to Track Instagram Engagement Rate
Last Updated on January 25, 2026 by Ethan
To track your instagram engagement rate properly, you need two things: a consistent way to calculate it, and a routine for checking it the same way every time. Do that, and you’ll stop guessing what “worked” and start seeing patterns you can actually repeat.
I’ve been tracking engagement on creator accounts for years (tiny pages, big pages, messy pages), and the big shift in 2026 is this: likes still matter, but saves, shares, and real conversations in comments are what move reach now. The annoying part is those “quiet” actions don’t always show up the same way in every tool, so you’ve gotta track smart, not just track more.
Here’s how I measure engagement rate day-to-day, how I interpret it by account size, and how to diagnose what’s actually going wrong when your engagement “randomly” drops (spoiler: it’s usually not random).
What “Instagram engagement rate” really means (and why people keep measuring it wrong)
At its simplest, engagement rate is a percentage that shows how many people interacted with a post, relative to your audience size (followers) or reach (views). That’s it.
Where people mess up is picking a formula once, then switching formulas when they don’t like what the number says. I’ve literally watched creators celebrate a “5% engagement rate” one week… and then quietly change the math the next week because it dipped. Been there. I did that early on too. Not proud.
The two engagement rate formulas you should actually use
-
Engagement rate by followers (ERF): best for consistency and benchmarking your own account over time.
Formula: (likes + comments + saves + shares) ÷ followers × 100
-
Engagement rate by reach (ERR): best for judging content quality, because it accounts for how many people really saw it.
Formula: (likes + comments + saves + shares) ÷ reach × 100
If you only pick one, pick ERR for content decisions and keep ERF for trend tracking. The reason is simple: reach can swing wildly post-to-post, even when the content is decent. Followers don’t swing as much, so it’s easier to compare.
How Instagram “counts” engagement in 2026 (How It Works)
Instagram’s ranking systems are basically trying to predict: “Will people care enough to stick around, interact, and share this with someone?” Engagement rate matters because it’s a fast proxy for that prediction.
But the weighting has changed a lot. I’ve tested this on multiple accounts over the last year, and the posts that pop off aren’t always the ones with the most likes. They’re the ones people save, DM to a friend, or comment on in a real way.
What tends to matter most now
-
Shares (especially DMs): the most “social” signal. If someone sends it to a friend, Instagram sees it as high-value.
-
Saves: huge for “useful” content. Checklists, tips, templates, mini tutorials.
-
Meaningful comments: back-and-forth beats “nice!” every time.
-
Watch time + completion rate: especially for Reels. If people finish it, that’s a loud signal.
-
Originality: Instagram-native posts tend to get rewarded; recycled stuff can get muted.
If you want a deeper breakdown of what’s shifting, this write-up on Instagram engagement rate in 2026 lines up with what I’m seeing in the wild.
Step-by-step: how to track your Instagram engagement rate (without getting lost)
You can do this with a spreadsheet, Notes app, or any analytics tool. The method matters more than the software. Consistency wins.
-
Pick your tracking window.
Daily if you post daily. Weekly if you post 2-4 times a week. Monthly if you’re doing brand reporting. Personally, I like weekly because daily numbers can be noisy (and honestly, it can mess with your head).
-
Decide which content formats you’re tracking.
Track Reels separate from carousel/feed posts and Stories. Mixing them muddies the data because the behavior is different. Reels are watch-time driven; carousels are save-heavy; Stories are reply-driven.
-
Collect the right metrics per post.
-
Feed/Carousel: likes, comments, saves, shares, reach
-
Reels: likes, comments, saves, shares, reach/plays, average watch time (if available)
-
Stories: replies, sticker taps, link clicks, exits, forward taps (these aren’t “engagement rate” the same way, but they explain a lot)
-
-
Calculate ERR and ERF for each post.
Yes, both. It feels like extra work for the first week. Then it becomes second nature.
-
Track medians, not just averages.
Here’s a real-world thing: one viral post can fake your “average engagement rate” for weeks. Medians keep you honest. When I started using medians, it was… painful. Like, “oh, that’s what my account really does most days.” Ouch.
-
Compare post types against themselves.
Reels vs Reels. Carousels vs carousels. If you compare a Reel to a photo post, you’ll make bad decisions fast.
-
Add one note per post.
Just one line: hook style, topic, CTA, posting time, collab tag, anything. This is how you turn numbers into strategy.
A lived-detail thing I’ve noticed (and it surprises people)
On larger accounts (100K+), engagement rate often looks “worse” even when the account is healthier. Why? You’ve got more passive followers, more explore reach, and more drive-by viewers. The content can still be performing great; it’s just being shown to a wider mix of people who don’t all smash like.
And on small accounts, engagement can spike randomly after you gain a few hundred followers because your content is finally hitting a clearer niche. It’s not magic. It’s matching.
Benchmarks: what a “good” engagement rate looks like in 2026
Benchmarks are useful as a sanity check, not a personality test. Your goal is to beat your own baseline consistently.
Engagement benchmarks by follower count
-
Nano (1K–10K): 3.5%–8%
-
Micro (10K–100K): 2.5%–5% (if you’re around 5K–10K, you can sometimes hit 5%–10% with the right content mix)
-
Mid-tier (100K–1M): 1.5%–3%
-
Macro (1M+): 0.8%–2% (top brands often hover around 1%)
Industry examples (because niches aren’t equal)
-
Consumer goods/retail: ~1.8%–2.1%
-
Media/entertainment: ~2%
-
Finance: ~1%–1.8%
-
Photography: ~4%
-
Fashion: ~2.2%
-
Volleyball: ~5.9% (yes, really)
If you like comparing against broader datasets, Socialinsider’s benchmark reports are a decent reference point. Don’t treat them like law, though. Your content mix matters more.
What to track beyond engagement rate (because ER alone can lie)
Here’s what nobody tells you: a “high engagement rate” can happen on posts that don’t grow you at all. You’ll see it when a post gets a bunch of likes from existing followers but barely any shares or reach.
So yeah, track engagement rate. But pair it with these:
-
Saves + shares per 1,000 reach: my favorite “quality” metric right now.
-
Follower growth per post: did this content bring new people in?
-
Profile actions: profile visits, website taps, DMs
-
Reels watch time: completion rate tells you if the idea held attention
If you’re building out a fuller system, bookmark this pillar resource: Instagram follower analytics complete guide. Engagement rate makes more sense when you can see it alongside follower churn and growth spikes.
Tools: native Instagram Insights vs third-party tracking
Instagram Insights is fine for basics. It’s also easy to lose history and context, especially if you’re juggling multiple clients or campaigns.
Third-party tools can be helpful for organizing and spotting patterns. But you have to be picky, because a lot of “analytics” apps are just scraping surface numbers and guessing the rest.
If you’re weighing the pros and cons, this breakdown is worth reading: Instagram Insights vs third party tools.
Where I use UnfollowGram in an engagement workflow
I don’t use follower tools to “boost” engagement. I use them to remove blind spots.
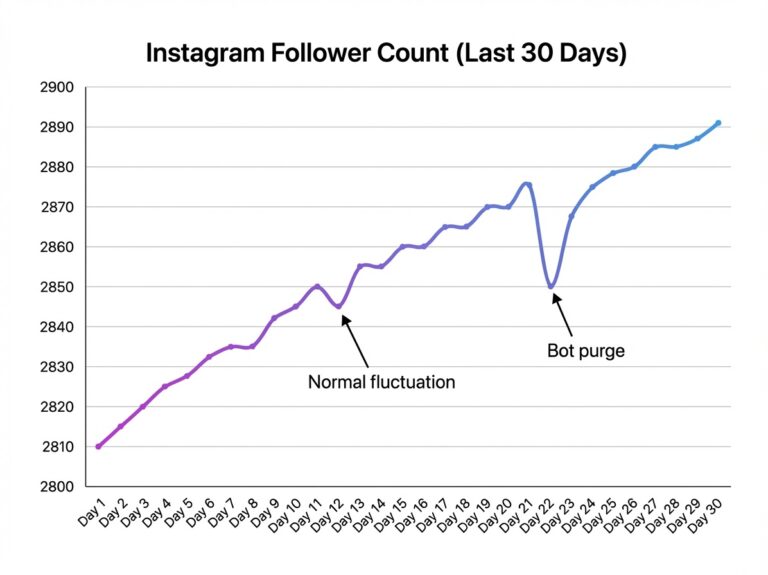
For public accounts, UnfollowGram Follower Tracker is handy when you’re tracking engagement rate week-to-week and you need context like: “Did I actually underperform, or did I lose a chunk of followers after that controversial post?” That follower churn can make engagement look weird for a bit.
One specific pattern I’ve seen: after a Reel goes semi-viral, you often get a wave of low-intent follows and then a wave of unfollows 3 to 7 days later. Your engagement rate can dip during that cleanup. It’s not always your content getting worse. It’s your audience getting rebalanced.
Timing, audience quality, and why your engagement rate drops “for no reason”
It’s usually not for no reason. It’s just not obvious.
Timing is real (but not in the cheesy way)
Posting at the “best time” won’t save weak content. But timing absolutely changes your early velocity, and early velocity affects distribution.
If you want a practical approach based on your follower activity (not generic charts), use this: best times to post based on followers.
Audience quality: the silent engagement killer
Fake followers and botty accounts don’t just sit there looking ugly. They drag down your normalized metrics and confuse your testing because they don’t watch, save, share, or buy.
I’ve seen accounts “fix” a 1.2% engagement rate without changing content at all, just by cleaning up followers and stopping giveaway-style growth loops. If you suspect that’s part of your problem, check this: how to identify fake followers on accounts.
Common mistakes I see when people track engagement rate
-
They track likes and comments only. In 2026, that’s like tracking calories but ignoring protein. You’re missing the signal that moves reach.
-
They compare Reels engagement rate to photo posts. Different behavior, different distribution, different expectations.
-
They don’t separate follower-based ER from reach-based ER. That’s how you end up thinking your account is “dying” when your reach is just fluctuating.
-
They don’t log the post context. Without notes, you can’t connect “why” to “what happened.”
-
They obsess over one bad week. I still catch myself doing this sometimes. One low week and my brain goes, “We’re cooked.” We’re usually not.
Failure modes: where engagement tracking falls apart
Okay, this is where things get weird.
Failure mode #1: engagement rate spikes because reach collapses
If your reach drops hard but your core followers still like/comment, your ERR can look amazing while your account is actually being shown to fewer people. That’s not a win. That’s a warning.
Failure mode #2: viral reach makes your engagement rate look “bad”
When you get pushed to cold audiences, lots of people watch and scroll. Your reach rises faster than interactions. Engagement rate drops. And yet, your account may be growing faster than ever.
This is why I always pair engagement rate with follower growth and shares. Otherwise you’ll accidentally stop doing the content that’s expanding your audience. Been there. Painful lesson.
Limitations (what tracking engagement rate won’t tell you)
-
It won’t tell you why people didn’t engage. Low engagement could be a weak hook, wrong audience, bad timing, or just a crowded news day. You need context notes and content review.
-
It doesn’t fully capture “private” engagement. DM shares and some story interactions can be hard to interpret outside Instagram’s own interface, and your mileage may vary depending on account type and what metrics Instagram exposes.
FAQ
What is a good engagement rate on Instagram?
A “good” instagram engagement rate depends on account size, but as a rough 2026 range: nano accounts often hit 3.5%–8%, micro 2.5%–5%, mid-tier 1.5%–3%, and macro 0.8%–2%.
Is a 2.5 engagement rate good?
Yes, 2.5% is solid for many micro and mid-tier accounts, especially if it’s driven by saves and shares, not just likes.
Is 5% engagement good?
5% is very good for most accounts above a few thousand followers, and it’s excellent if your reach is growing at the same time.
Is a 6 engagement rate good?
6% is great for nano and many micro accounts, but double-check you’re using a consistent formula and not accidentally inflating it by using a tiny reach number.
Wrapping it up (and a simple workflow you can stick to)
If you want engagement tracking that actually helps, keep it boring: pick ERF and ERR, track weekly, separate formats, and log one note per post. Then make decisions off patterns, not vibes.
And if you want extra context around follower changes while you’re watching engagement trends, tools like UnfollowGram can help you spot when engagement shifts are really audience shifts. If you’re curious, you can check out UnfollowGram at unfollowgram.com and see if it fits your routine.
One last thing: don’t chase a single “perfect” engagement rate. Chase repeatable posts that earn saves, shares, and watch time. That’s what the platform is paying for right now.

Ethan is the founder of UnfollowGram with more than 12 years of experience in social media marketing. He focuses on understanding how Instagram really works, from follower behavior to engagement patterns, and shares those insights through UnfollowGram’s tools and articles.